1. Device Traffic Analysis 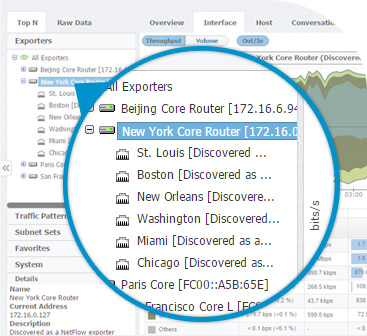
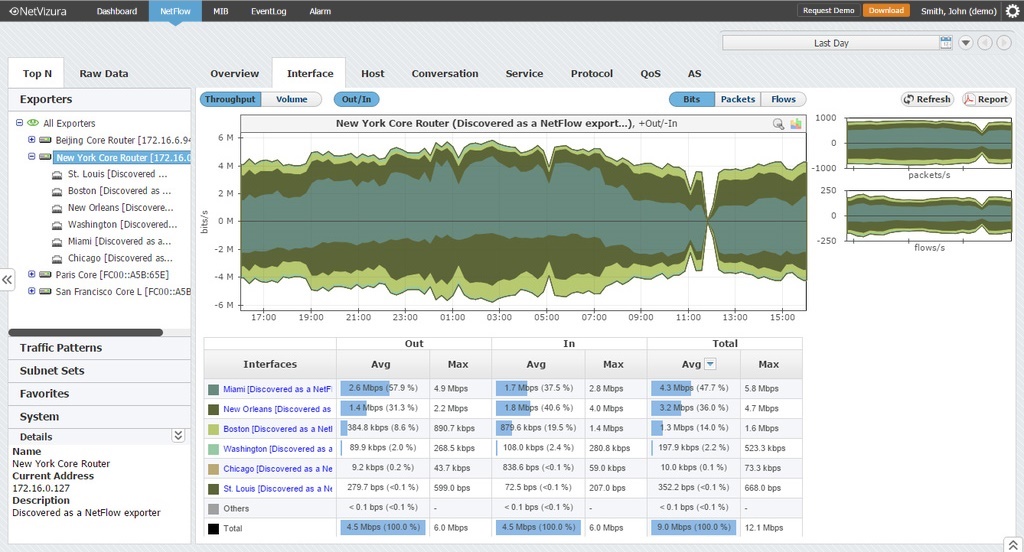
1. Device Traffic Analysis
-
Networking Devices
Use facts to plan your load balancing, network capacity and expansion.
-
Networking Interfaces
Optimize your interface usage, block unwanted traffic and prioritize mission-critical applications.
-
Traffic Distribution
Explore device traffic structure - how it is distributed by various dimensions.
2. Custom Traffic Analysis 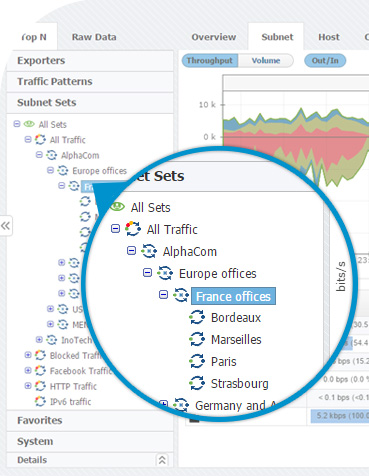
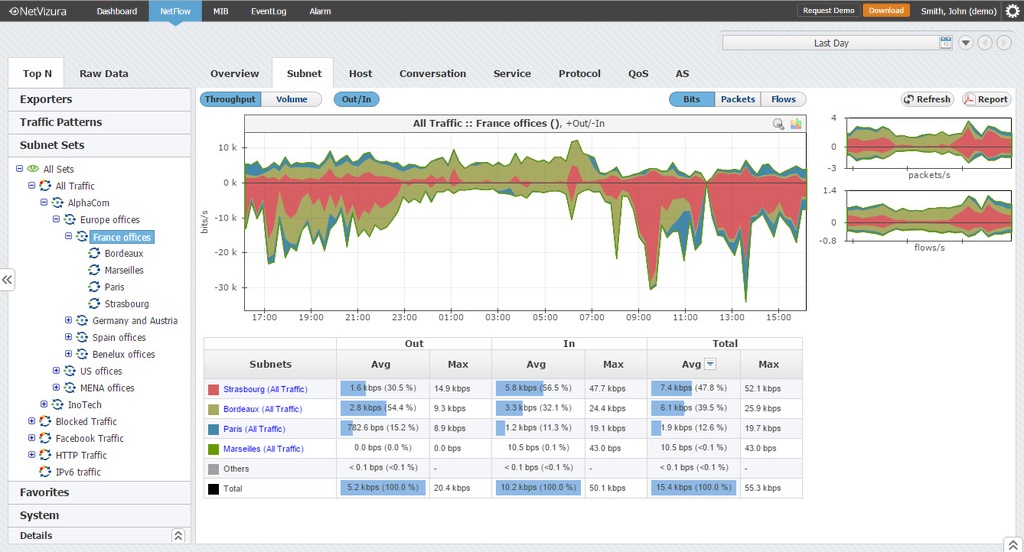
2. Custom Traffic Analysis
-
Traffic Types
Internet, site-to-site, specific application, blocked, social media and torrent traffic are all at your fingertips.
-
Organizational Units
Monitor and analyze traffic data per department, remote office, group of regional offices etc.
-
Traffic Distribution
Explore custom traffic structure - how it is distributed by various dimensions.
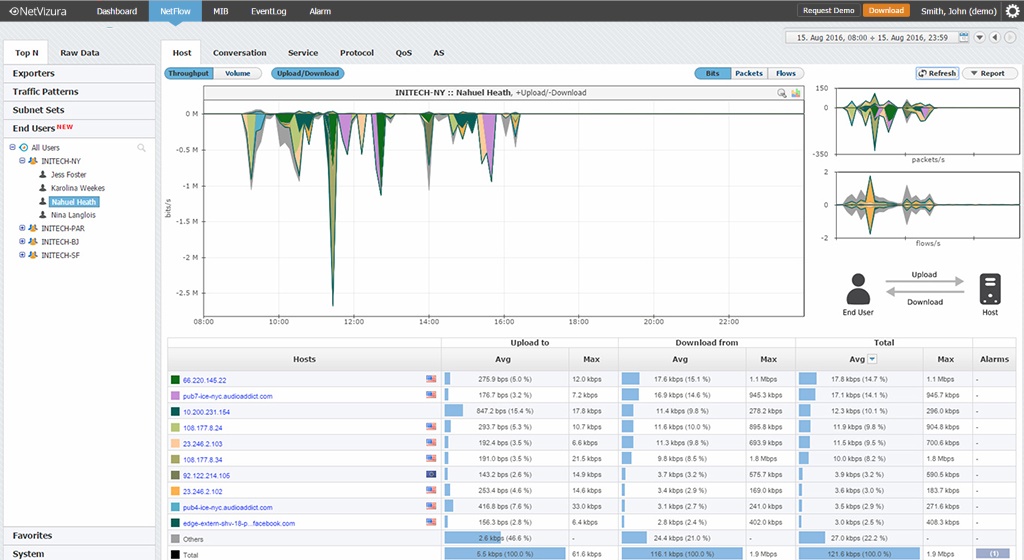
3. End User Traffic Analysis 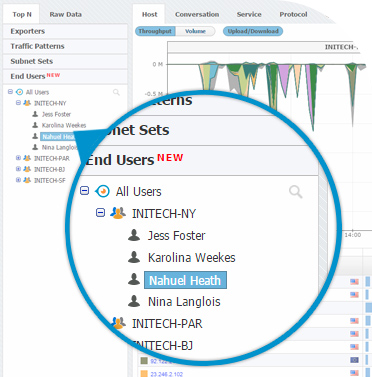
3. End User Traffic Analysis
-
Network Domains
Get a unique perspective on the traffic made by your network users.
-
Network Users
Identify user's needs towards your network, discover illegitimate network use, and investigate security risks.
-
Traffic Distribution
Explore end user traffic structure - how it is distributed by various dimensions.
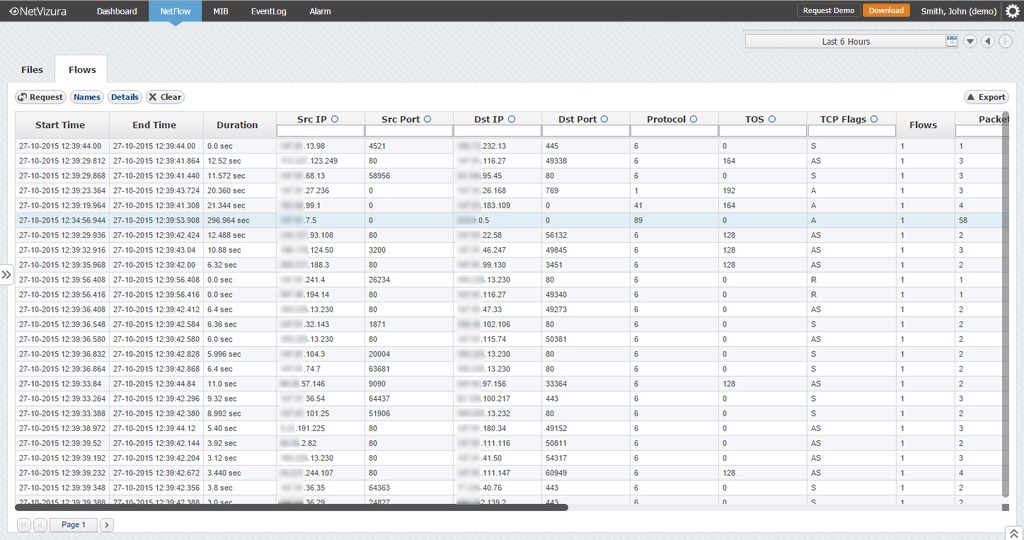
4. In-Depth Forensics 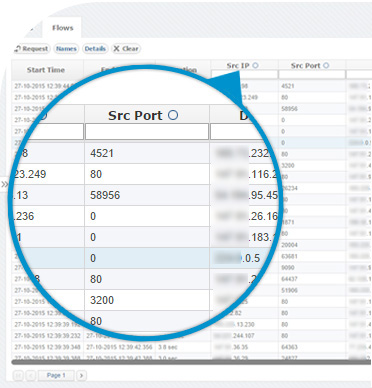
4. In-Depth Forensics
-
Multi-perspective Charts and Tables
Gain full perspective and troubleshoot faster by using multiple views and drill-down into any monitoring node.
-
Raw Data Archive
Investigate traffic anomalies and gain insight in security related issues, even if months old.
5. Traffic Reports 
5. Traffic Reports
-
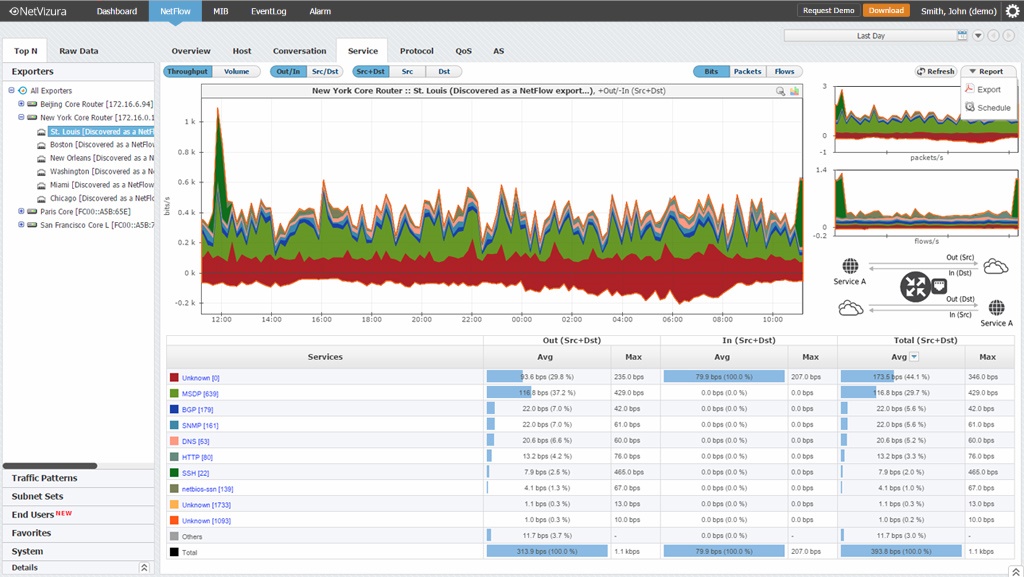
Export
Get network traffic data outside NetVizura for further show, discussion and analysis.
-
Email Scheduling
Automatically deliver traffic reports to 3rd parties working outside of your department.
6. Threshold Alarms 
6. Threshold Alarms
-
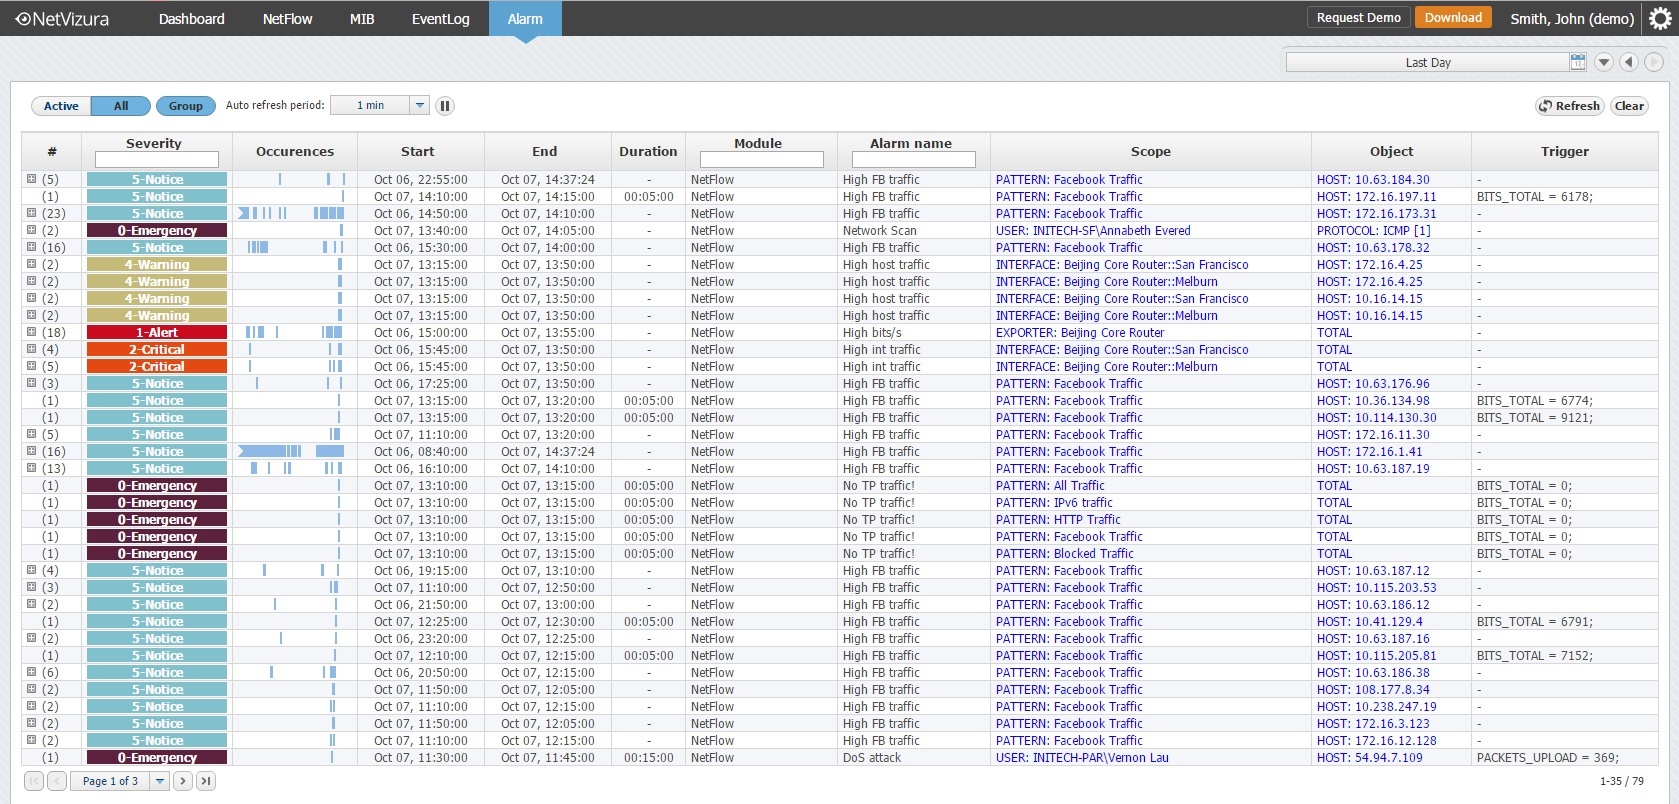
Throughput and Volume Alarms
Now you can use both throughput and volume alarms, depending on what traffic do you want to monitor.
-
Email Notifications
Gain faster reaction speed and react quickly on alarms set on your devices, custom traffic and end users.
-
Alarm Overview
Check and act-on key events in your network from one central place.
7. Dashboard Overview 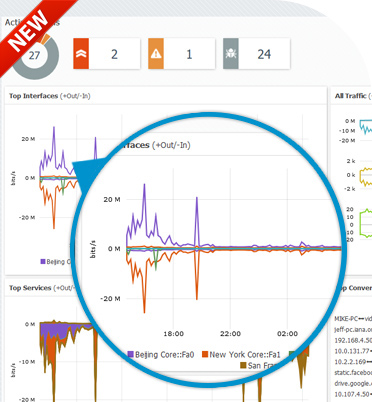
7. Dashboard Overview
-
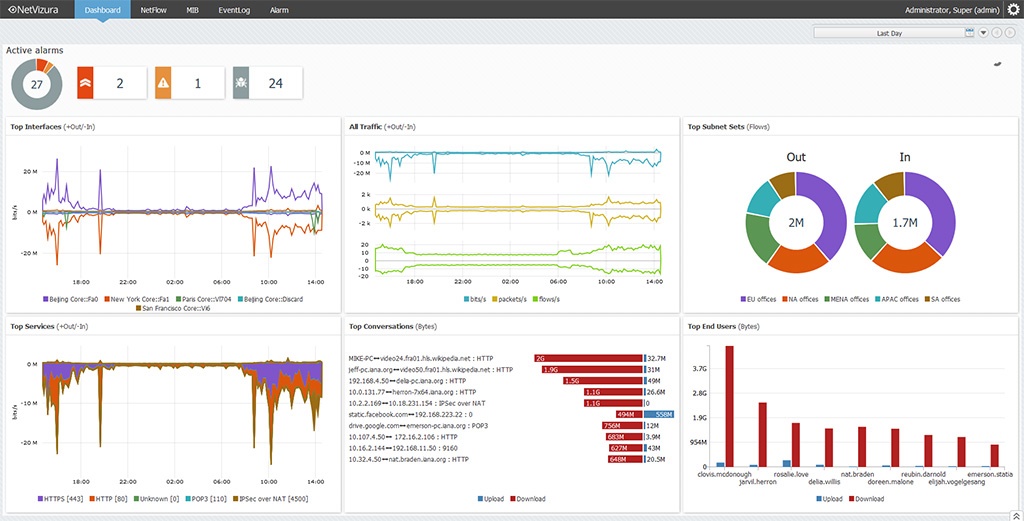
Real-time Alarms
Reduce significantly your response and troubleshooting time by having all active alarms presented and prioritized clearly.
-
Key Network and Security Monitors
Improve your network visibility, understanding, and contextual awareness by showing key traffic monitors side-by-side.
8. Powerful Settings 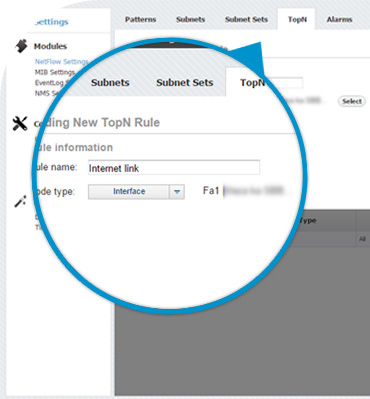
8. Powerful Settings
-
Flow Sampling & Filtering
Collect, process and analyze only what is necessary.
-
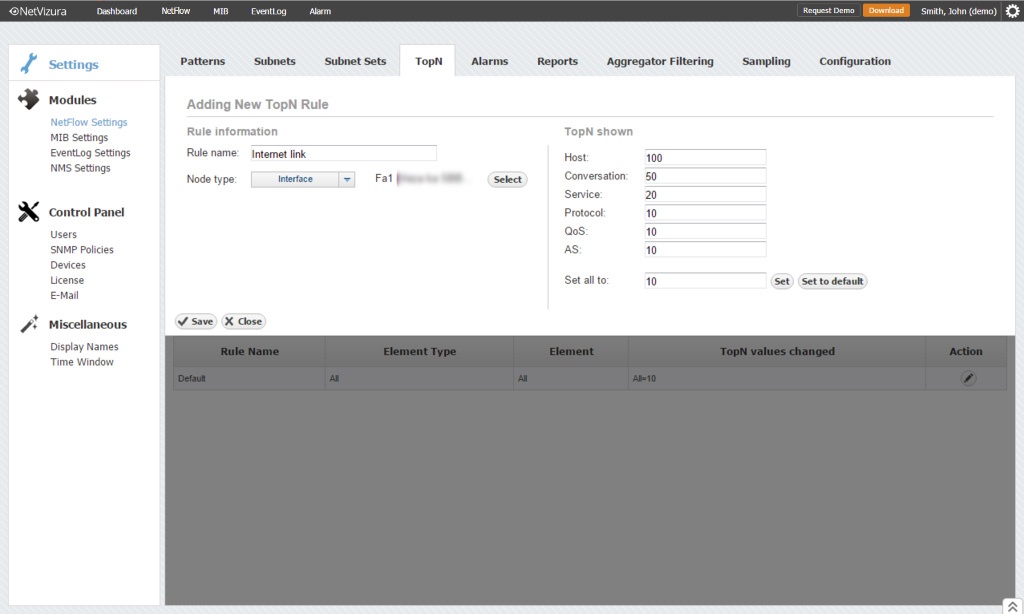
TopN Rules
Fine-tune specific traffic granularity according to your need.
-
Data Management
Manage database and archive size automatically by setting grains, size and conditions for deletion.
9. Flexible Data Collection 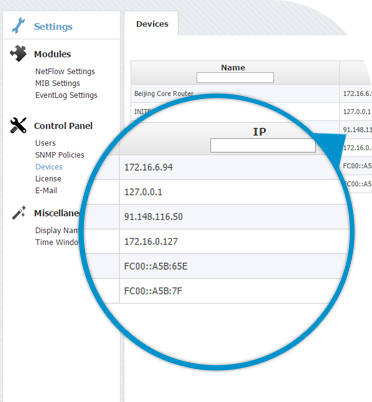
9. Flexible Data Collection
-
Multi-Vendor Support
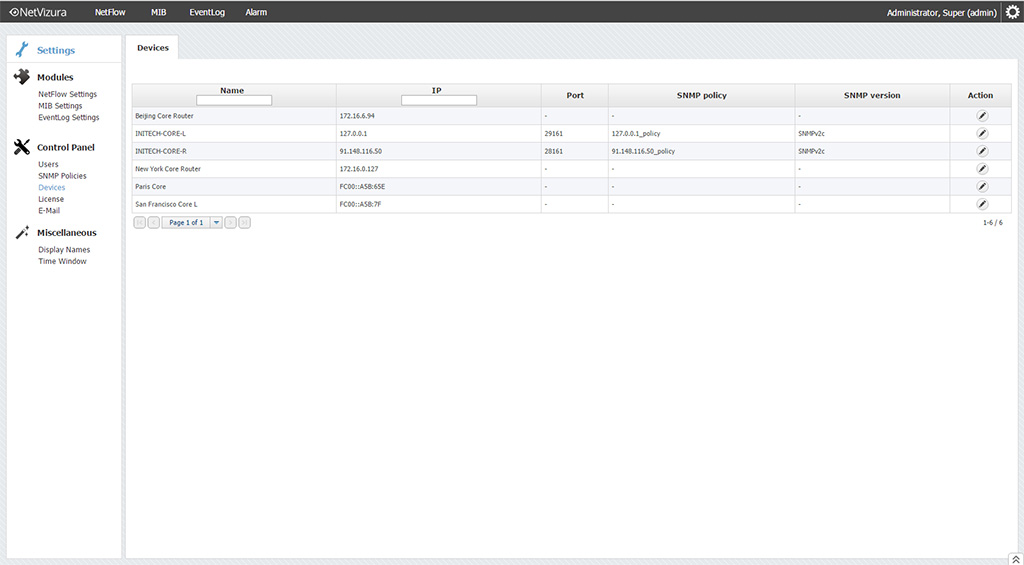
Collect NetFlow from Cisco, Juniper, HP and many other vendors.
-
Few Devices
There is no more need for an additional hardware, that is expensive and difficult to maintain.
-
Any Device
No NetFlow capable device? No problem!
System Requirements
| Hardware | CPU | RAM | HDD Space | Assumptions |
|---|---|---|---|---|
| for 50 fps max | Single core 2.0GHz | 2GB | 5 GB |
5 fps on average |
| for 500 fps max | Single core 2.0GHz | 3GB | 10 GB | 50 fps on average 120 monitored nodes 30 days Raw Data archive and 365 days of Database history stored |
| for 5.000 fps max | Dual core 2.0GHz | 4GB | 120 GB SAS or SSD in RAID 0 or similar setup with stripping |
2.000 fps on average 420 monitored nodes 30 days Raw Data archive and 365 days of Database history stored |
| for 50.000 fps max | Octa core 2.0GHz | 8GB | 2.4 TB SAS or SSD in RAID 0 or similar setup with stripping |
35.000 fps on average 1.400 monitored nodes 30 days Raw Data archive and 365 days of Database history stored |
| for 50.000+ fps | Contact Us |
| Software | Comes with NetVizura | Notes |
|---|---|---|
 Oracle Java 8, OpenJDK 8 Oracle Java 8, OpenJDK 8 |
Yes (Linux) No (Windows) |
Automatically installed with Linux packages Required for Windows installer |
 Apache Tomcat 7, 8 or 9 Apache Tomcat 7, 8 or 9 |
Yes (Linux) No (Windows) |
Automatically installed with Linux packages Required for Windows installer |
 PostgreSQL 12+ PostgreSQL 12+ |
Yes (Linux) No (Windows) |
Automatically installed with Linux packages Required for Windows installer PostgreSQL12 is recommended |
 Elasticsearch 7 Elasticsearch 7 |
Yes (Linux) No (Windows) |
Automatically installed with Linux packages Required for Windows installer |
| Supported OS | Distributions and Versions | Notes |
 Linux Debian Linux Debian |
Debian Bookwork 12 ( 64bit) Debian Bullseye 11 (64 bit) Debian Buster 10 (64 bit) |
Required for DEB package |
 Linux Ubuntu Linux Ubuntu |
Ubuntu Noble Numbar 24.04 LTS (64bit) Ubuntu Jammy Jellyfish 22.04 LTS (64-bit) Ubuntu Focal Fossa 20.04 LTS (64-bit) |
Required for DEB package |
 Linux CentOS Linux CentOS |
CentOS 8 (64 bit) CentOS 9 (64 bit) |
Required for RPM package |
 Windows Windows |
Windows Server 2016 (64 bit) |
Required for WIN installer |
Supported Browsers

Chrome 35.0+

Firefox 26.0+

Safari 10.0+
Why NetVizura NetFlow Analyzer?
More than bandwidth monitoring
Why stop at bandwidth consumption monitoring?
NetVizura is a powerful analytic tool that gives your network team more information: extensive flow records with no archive size limit, flow and packets charts in addition to standard bits charts, to name a few. Boost your capacity to troubleshoot faster and increases your network security in addition to bandwidth monitoring!
Custom traffic monitoring
Why monitor just interface traffic when you can monitor any traffic?
NetVizura allows you to define custom traffic to be monitored based on IP subnets and traffic characteristics like protocol and service used. Monitor specific traffic for each organisational unit in your network such as departments, remote sites and collections of regional offices by identifying them with IP subnets.
More visibility with less NetFlow routers
NetVizura NetFlow Analyzer allows you to enable NetFlow export on just a few routers and still get network-wide traffic statistics segmented into IPsubnets that represent departments and remote offices.
No NetFlow capable device? No problem!
Get full statistics without any NetFlow capable device by installing a free software for NetFlow capture and export.Traffic will be separated into different segments by IPsubnets and monitored viaTraffic Patterns.
Simple pricing
NetVizura NetFlow Analyzer license is based solely on the flow rate of your network. There are no limitations to the number of NetFlow routers, interfaces, hosts or users.
Security boost
Unlike firewalls, NetFlow Analyzer focuses on a quick reaction. NFA does not know what is being faced with, but it can trace anomaly and help you react fast and smart, and later even investigate further.
Why NetVizura NetFlow Analyzer?
NetVizura is a powerful analytic tool that gives your network team more information: extensive flow records with no archive size limit, flow and packets charts in addition to standard bits charts to name a few. Boost your capacity to troubleshoot faster and increases your network security in addition to bandwidth monitoring!
NetVizura allows you to define custom traffic to be monitored based on IP subnets and traffic characteristics like protocol and service used. Monitor specific traffic for each organisational unit in your network such as departments, remote sites and collections of regional offices by identifying them with IP subnets.


