-
Visualization
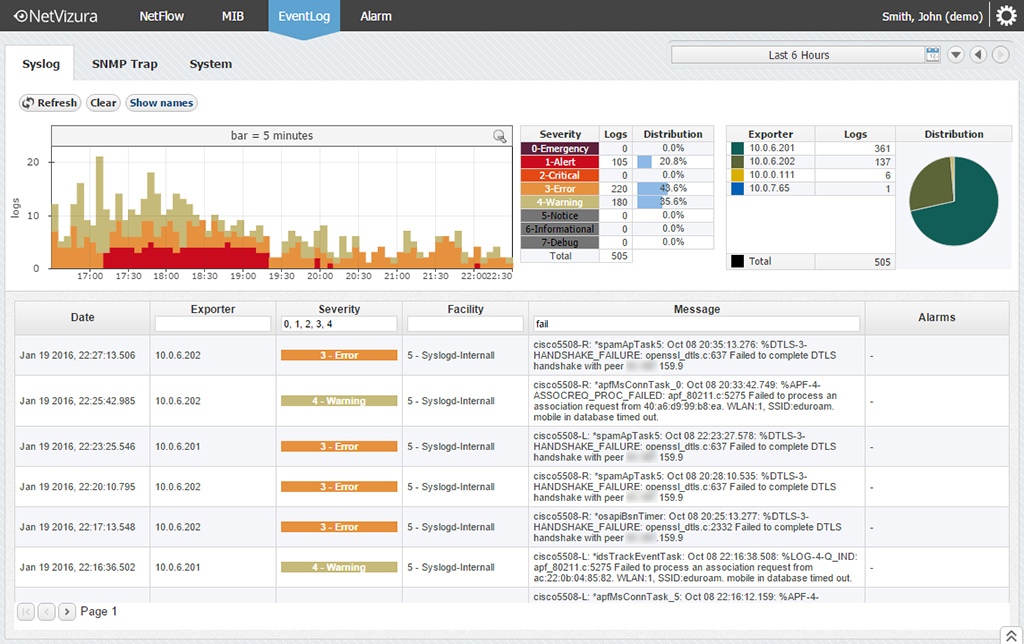
Troubleshoot faster - Drill down into logs of any monitored device by using filters and zooming in on relevant time.
Analyze faster - get network health insight at a glance. Log severity levels and device contribution are highlighted on two charts. Color mapping of severity level makes identifying critical logs and their numbers quick.
-
Quick Filters and Search
Get through thousands of logs quickly with one click filters and search options. Filter logs by device IP, log severity, time stamp or log message text in few clicks.


